reconfigured blog
We write about our customers use cases, product updates, and AI.
Featured Posts

Pair Thinking with AI: How to Use ChatGPT as Your Research Partner
Turn ChatGPT — and purpose-built tools like Notes – reconfigured — into a real research partner. Learn the workflow, prompts, pitfalls, and best practices for pair thinking with AI.
The $100,000 Per Day Mistake: Why Domain Knowledge Trumps Technical Skills
Discover why domain knowledge trumps technical skills in regulated analytics. Brad Lumley shares how business context helps navigate complexity and avoid $100k/day mistakes.
Brick by Brick - How Kate Builds Knowledge Without Constraints
Meet Kate, a data professional who's found freedom in reconfigured's flexible approach to note-taking. Discover how she captures meeting notes, documents data challenges, and builds her knowledge base without the rigid structure of traditional tools.
Latest Posts
reconfigured vs NotebookLM: A Better Research Workflow
See why reconfigured outperforms Google’s NotebookLM for real research—instant capture, AI organization, and reusable outputs that compound your team’s knowledge.
ADHD Notes That Work: Practical ADHD Note-Taking Strategies + Ready-to-Use Templates
ADHD-friendly note taking that actually sticks: practical strategies, simple templates, and a weekly workflow to capture, find, and act on your notes.
From Pile to Insight: Building a Literature Review with AI
Use ChatGPT — and Notes – reconfigured — to turn scattered clips into a credible, citable literature review. Step‑by‑step workflow, prompts, matrices, and export tips.
Pair Thinking with AI: How to Use ChatGPT as Your Research Partner
Turn ChatGPT — and purpose-built tools like Notes – reconfigured — into a real research partner. Learn the workflow, prompts, pitfalls, and best practices for pair thinking with AI.
The $100,000 Per Day Mistake: Why Domain Knowledge Trumps Technical Skills
Discover why domain knowledge trumps technical skills in regulated analytics. Brad Lumley shares how business context helps navigate complexity and avoid $100k/day mistakes.
Single-Tenant Database Architecture: The Secret Weapon for B2B Apps in the AI Era
A deep dive into why per-tenant databases provide better isolation, security, and AI capabilities for modern applications
The Stahlman Method: A Guide to Connecting Macro and Micro in Data Analysis
In this interview, Senior Quantitative Analyst Roger Stahlman shares his methodology for connecting big picture thinking with detailed analysis to uncover the truth in data.
The Context Revolution in Analytics: Lessons from Paradime's Approach
Discover how contextual understanding in AI is transforming analytics engineering, eliminating translation barriers, and empowering additional team members to contribute directly to data projects.
Vibe Coding: How AI-Powered Design-to-Code Transforms Developer Workflows
Discover how AI-powered design-to-code workflows are transforming developer productivity and bridging the gap between design and implementation

Why Cloudflare is the Perfect Infrastructure for Building AI Applications
Why Cloudflare's durable objects and serverless architecture are ideal for building stateful AI applications like MCP servers
MCP Guide: Understanding The Protocol Powering the AI Agent Ecosystem
Deep dive into the Model Context Protocol (MCP), how it works, and why it's the perfect API specification for the AI era
The Death of Final Form - Why Everything Should Stay in Draft
Discover why our obsession with final documentation is outdated and how embracing a continuous draft mindset with AI integration transforms knowledge sharing and creates more effective workflows.
From Notes to Actions: MCP, Agents, and Curated Context Directly from Your Notepad
Discover how Model Context Protocol (MCP) and AI agents can leverage the rich context in your notes to perform tasks automatically, turning your personal knowledge into a powerful resource for your digital workforce.

UI Blueprints in Code - How We Cut Design Implementation Time by 80%
How we use AI and code-based design to create functional blueprints that streamline the design-to-code workflow.
Context-Aware Notetaking - Why AI Is Finally Making Your Second Brain Actually Useful
Exploring the evolution of notetaking in the age of AI, from scattered thoughts to intelligent second brains that understand your intentions.
Beyond the Chat Box: The Future of AI-Native Interfaces
AI is radically transforming how we interact with technology. What will the next generation of AI-native user interfaces look like, and where is the agent ecosystem evolving towards?
The Engineering Journal - Your Secret Weapon for Problem-Solving
How keeping an engineering journal can transform your productivity, help you solve recurring problems faster, and supercharge your career growth.
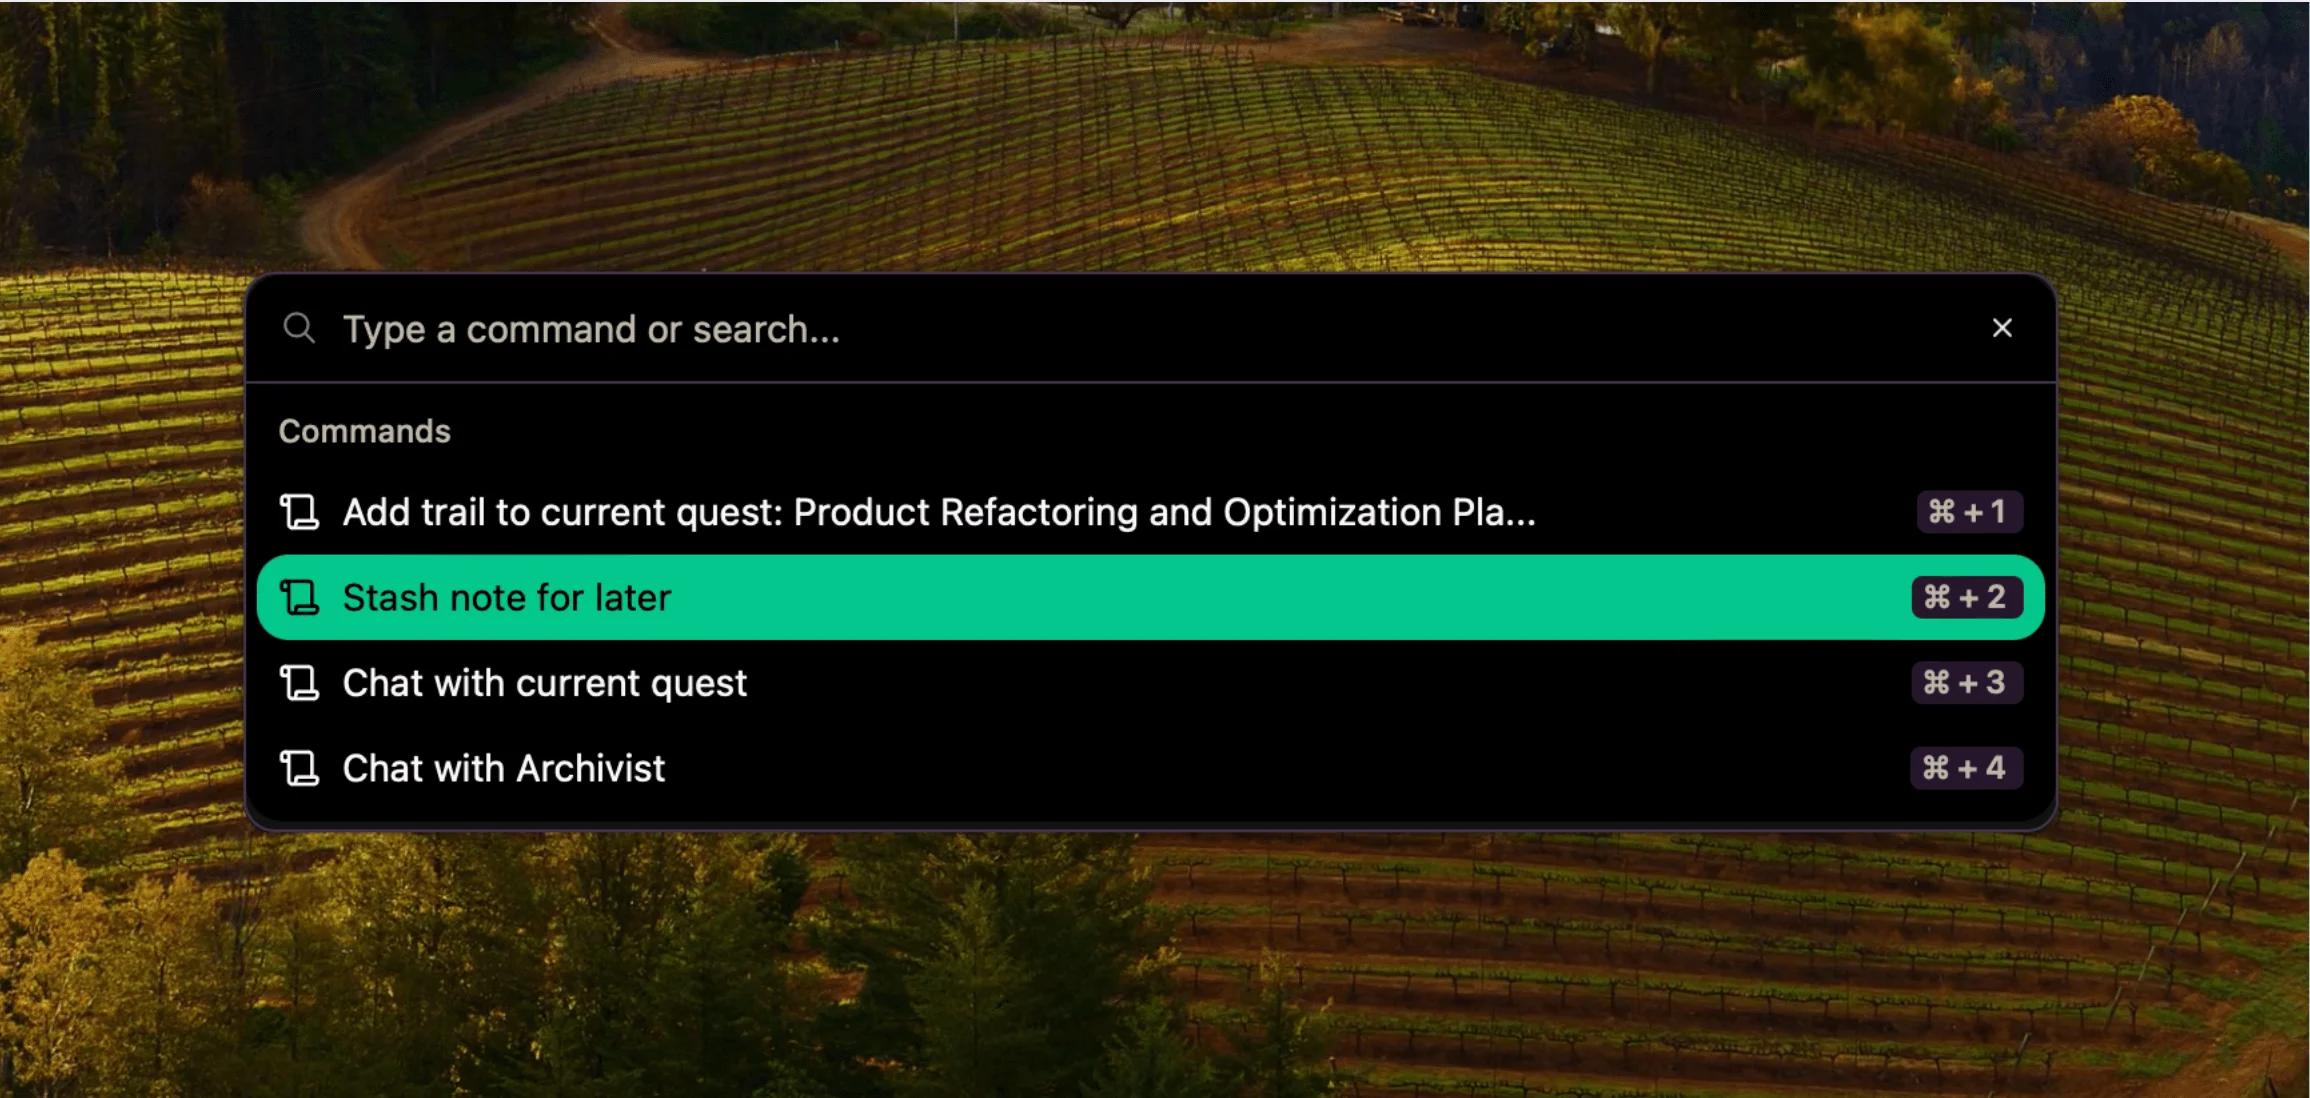
Dump Thoughts Now, Sort Later - A Guide to Stashed Notes
Stop losing brilliant ideas while searching for the perfect place to store them. Learn how reconfigured's "stash for later" feature can transform your note-taking workflow and save those valuable thoughts before they vanish forever.

The Data Detective's Toolkit: How Miguel Captures Every Insight
Discover how product analytics manager Miguel Curiel uses reconfigured to capture his investigative thought process, centralize project notes, and deliver better insights to stakeholders
From SQL to Insights - How Juan Tames Information Chaos
Meet Juan Ramos, a data professional who uses reconfigured to maintain flow while managing complex analytics projects. Discover his real-world workflow combining query development, documentation, and task management in one lightweight tool.
The Documentation Time Paradox
Why does documentation always feel like it "takes too much time"? We explore the hidden friction points in capturing valuable knowledge and how journaling might be the solution we've been missing all along.
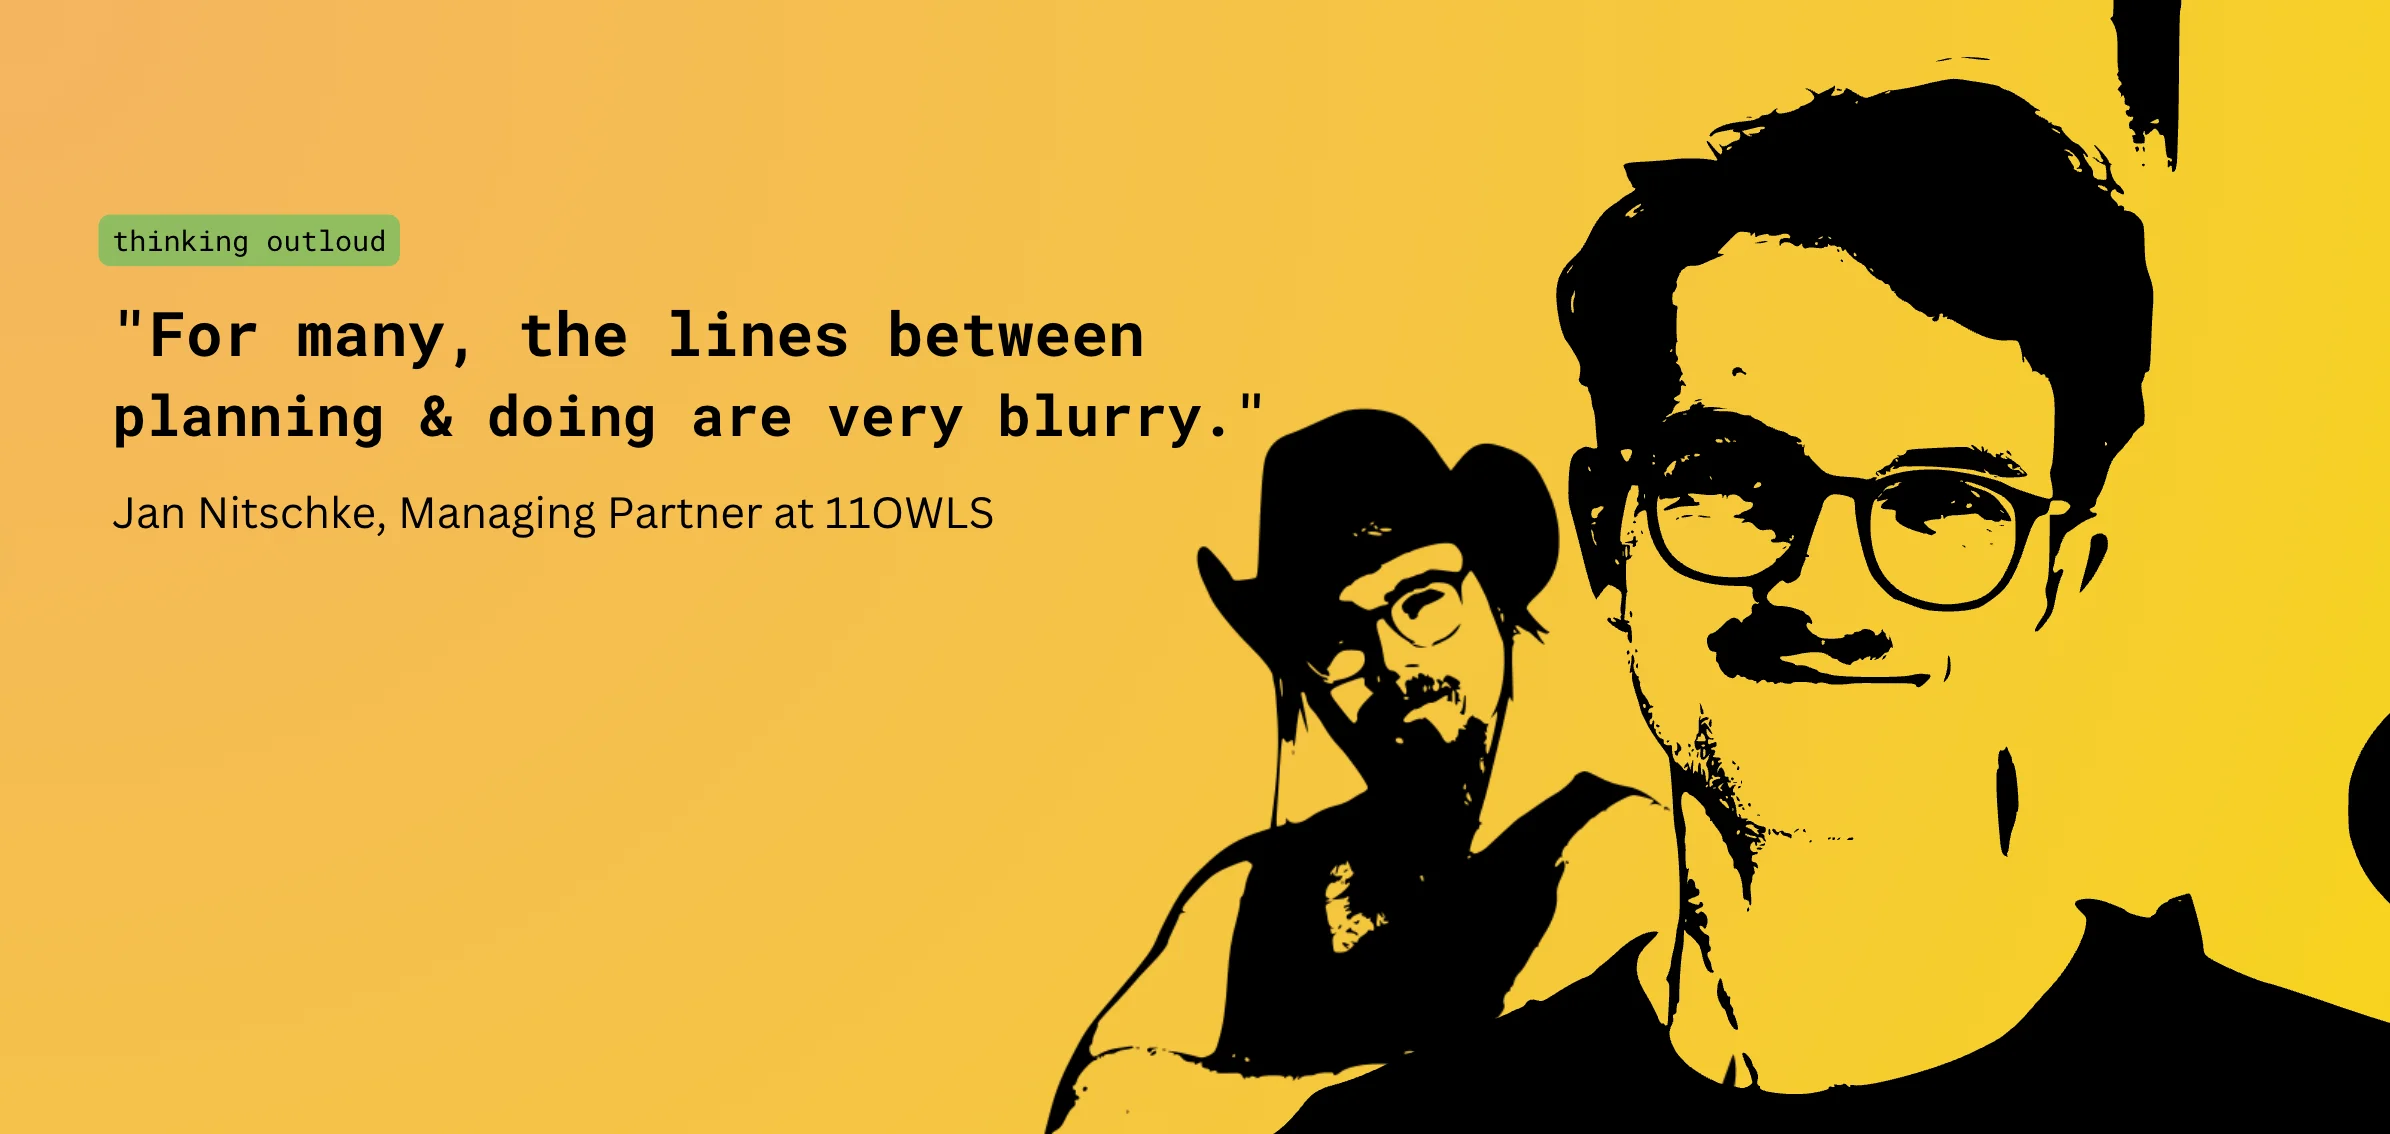
The Planning-Doing Spectrum - Finding Balance in Knowledge Work
Exploring the blurry line between planning and doing in knowledge work and how AI agents can help bridge the gap. Learn why capturing context in both modes is essential for effective collaboration.
Brick by Brick - How Kate Builds Knowledge Without Constraints
Meet Kate, a data professional who's found freedom in reconfigured's flexible approach to note-taking. Discover how she captures meeting notes, documents data challenges, and builds her knowledge base without the rigid structure of traditional tools.
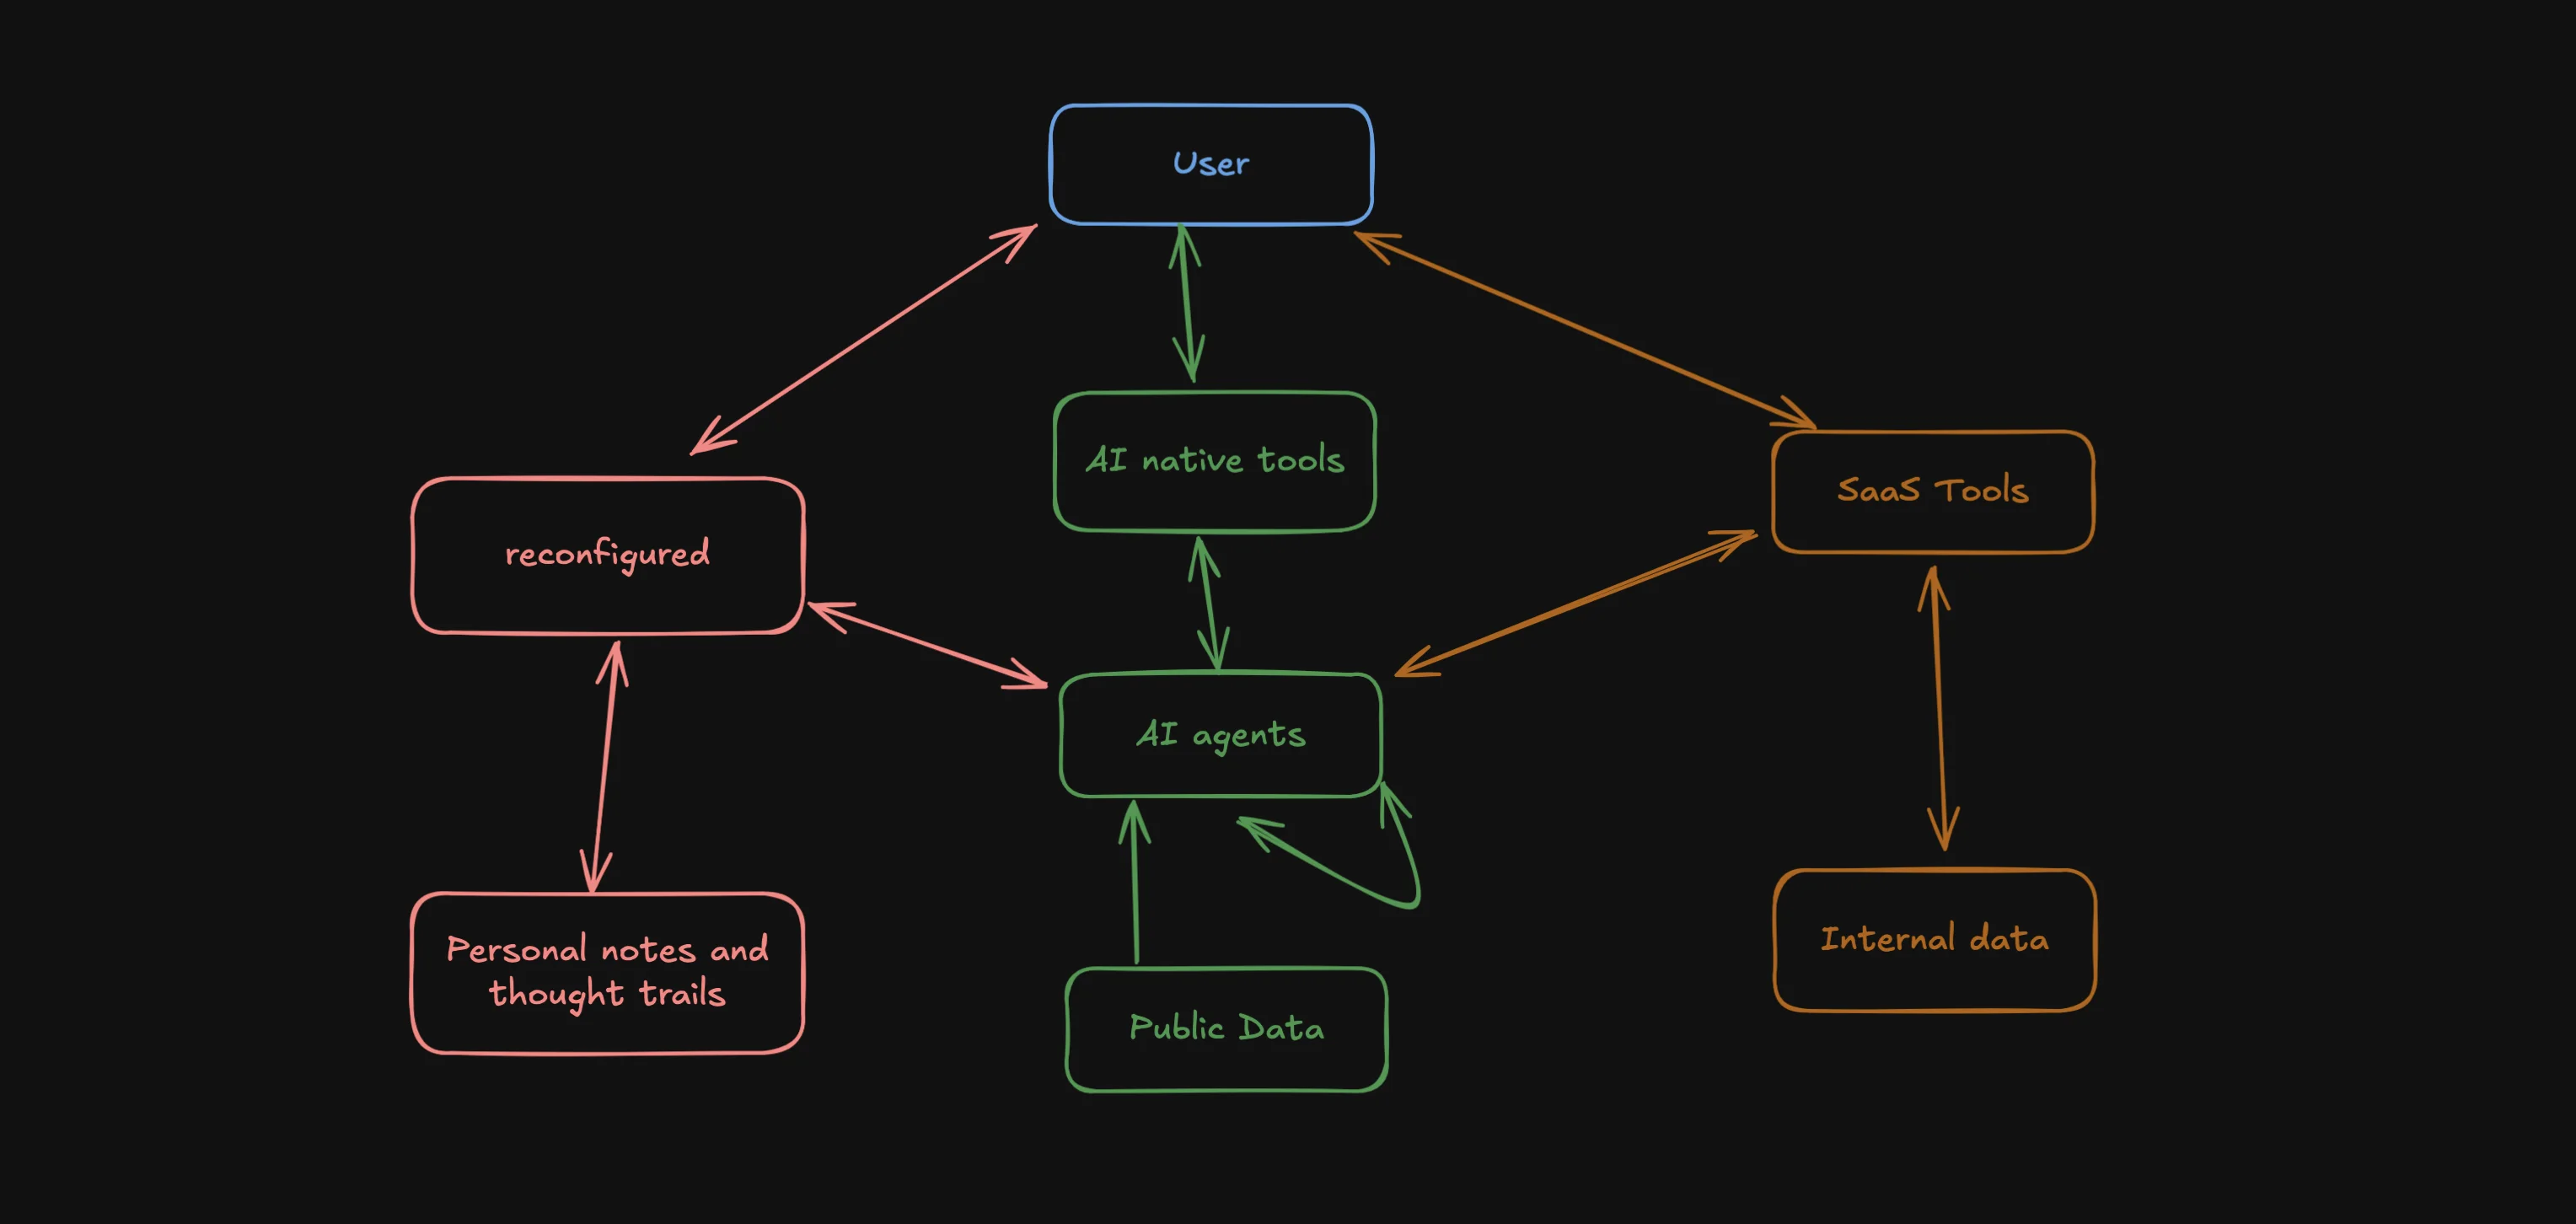
The Evolving AI Agent Ecosystem - Why One Agent Won't Rule Them All
Exploring the emerging ecosystem of AI agents and how they'll work together, share data, and enhance our productivity. Learn why reconfigured is uniquely positioned in this new landscape.